How to Spot Output Abandonment Before Retention Drops
Spot output abandonment before retention drops. Learn which AI adoption metrics show when users read, edit, regenerate or apply AI output.

Your AI feature can look healthy right up to the point where retention drops.
Users are submitting prompts. The model is responding. Sessions are not empty. Maybe the first-use funnel even looks fine.
Then week two or week three gets soft. People who tried the feature do not come back for the next job. The common reaction is to inspect onboarding, pricing or model quality. Those may matter, but they are often too broad.
The earlier signal is usually output abandonment.
Output abandonment happens when a user receives AI output, reads it, maybe reacts to it, then does not move it into the real workflow. They do not use it, edit it into shape, save it, share it, commit it, cite it or send it. The output was generated, but the job did not advance.
That distinction matters. Retention is the delayed symptom. Output abandonment is where the break starts.
What output abandonment looks like in usage data
The trap is that most analytics setups stop at generation. They tell you that the AI responded, not whether the response was useful enough to carry forward.
A completed generation event is not adoption. A high prompt count can hide users struggling to get one usable result. Long dwell time can mean careful review, but it can also mean uncertainty. Copy events can mean success, or they can mean the user left your product to fix the output somewhere else.
Start by looking for behavior after the output appears.
| Signal | Likely read | What to check next |
|---|---|---|
| High generation completion, low apply rate | Output is being produced but not trusted or usable | Compare output format to the destination workflow |
| Long read time, no save or send action | User is evaluating but not confident enough to act | Look for missing sources, assumptions or review cues |
| Many regenerations, no final use | User cannot steer or select a usable answer | Inspect prompt burden and variation quality |
| Copy event followed by no in-product action | User may be repairing the output elsewhere | Ask where the output goes after copy |
| Editing starts, then stops | Correction feels more expensive than starting over | Review the edit loop and recovery actions |
This is why a retention review that starts with weekly active users is often late. By the time WAU drops, users have already learned that the AI creates extra work. If you need a broader measurement frame, use retention signals that track whether output returns to the job, not just whether the user returns to the feature. That is the core idea behind measuring AI feature retention beyond weekly active use.
Define the application event first
Before adding more dashboards, decide what “used” means in your product. This is not universal.
For a writing assistant, use might mean inserted into a draft and kept after editing. For a coding assistant, it might mean accepted, tested and not immediately reverted. For a research assistant, it might mean saved to a workspace, cited in a brief or shared with a teammate. For a support copilot, it might mean sent to a customer after modification.
If you do not define the application event, every team will pick the metric that flatters its part of the funnel. Product will point to activation. ML will point to successful responses. Growth will point to feature discovery. None of those prove the user trusted the output enough to use it.
A simple lifecycle is enough for most teams.
| Stage | Example event | What it tells you |
|---|---|---|
| Generated | Output rendered | The system completed its part |
| Inspected | User scrolled, expanded or spent time reading | The output earned attention |
| Modified | User edited, constrained or regenerated | The user is trying to make it fit |
| Applied | User inserted, saved, sent, exported or committed | The output advanced the job |
| Reentered | User returns for the next similar job | The behavior may become a habit |
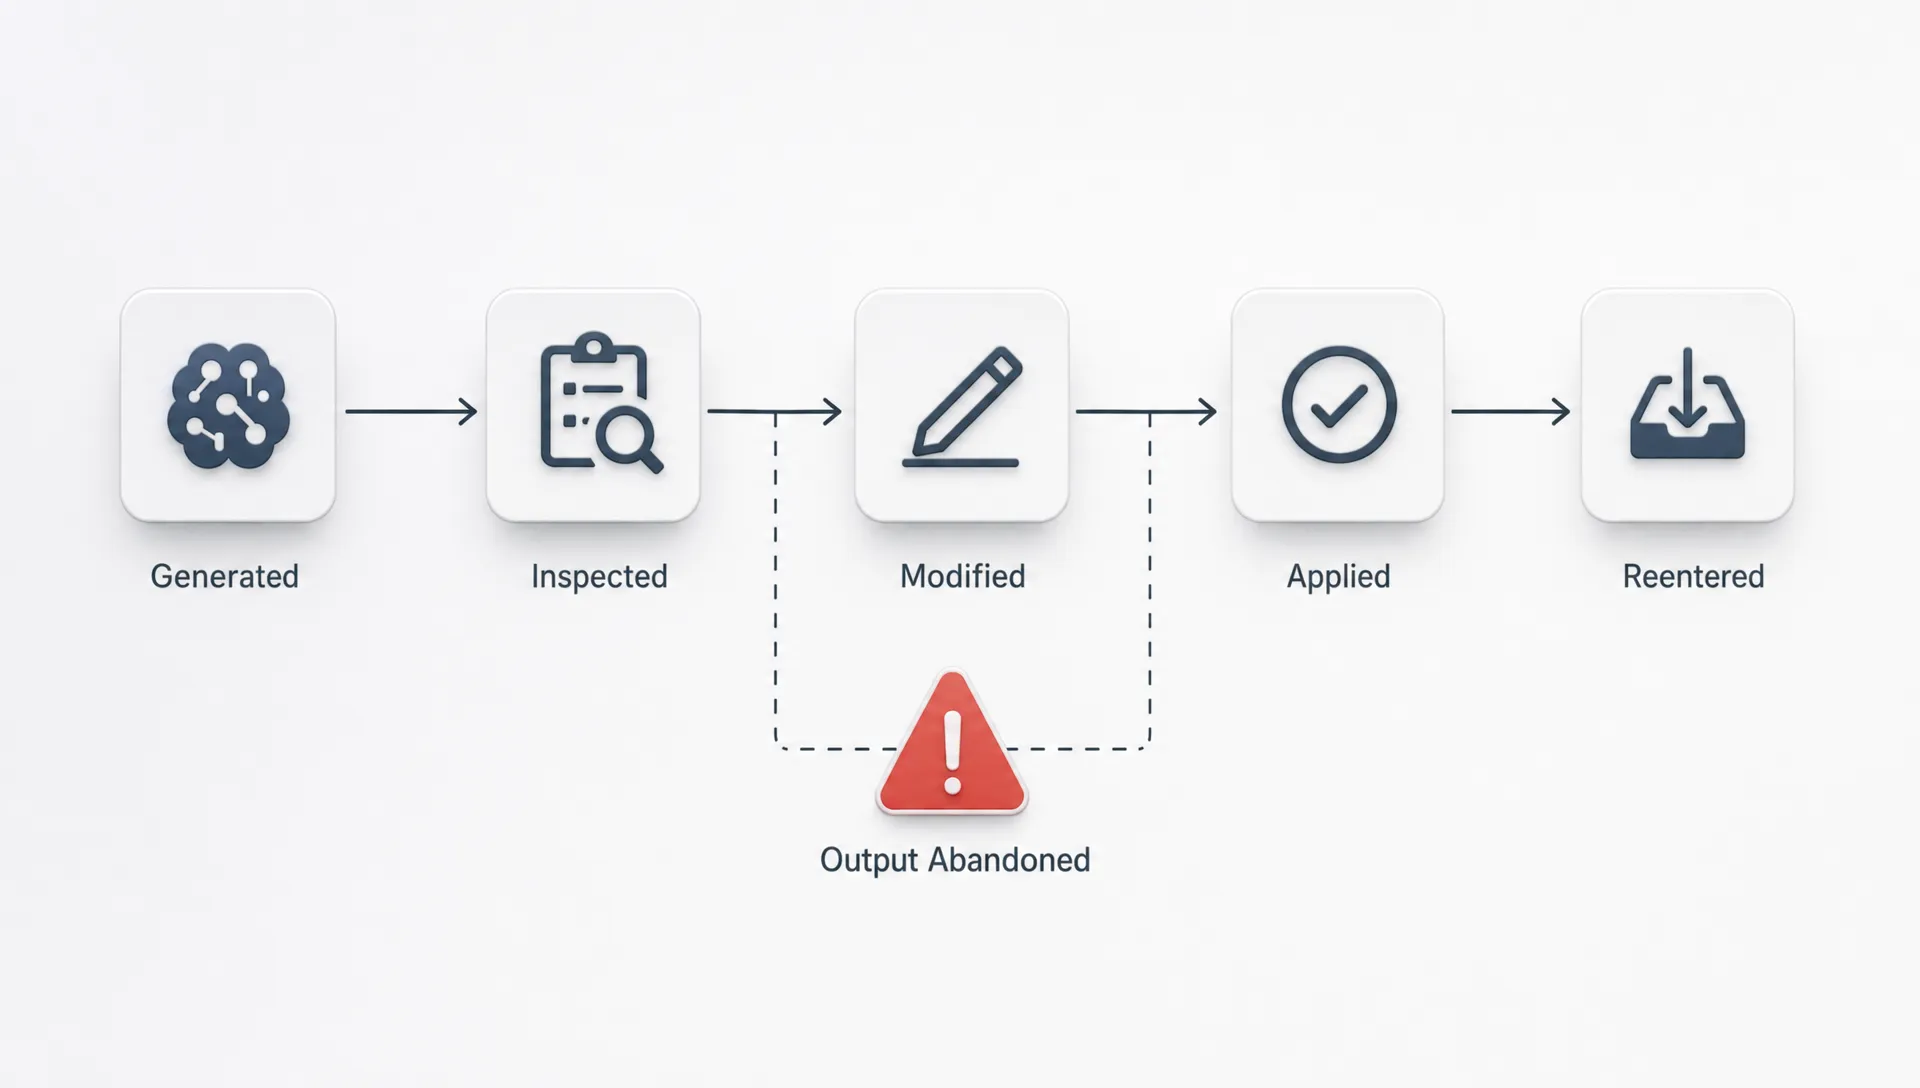
The early warning metrics that matter
Once you have an application event, you can spot output abandonment before retention drops. Do not start with ten metrics. Start with the few that explain whether the output crosses the gap between “interesting” and “usable.”
Output application rate is the percentage of generated outputs that reach the application event. Segment it by job type, user role and entry point. A low average is less useful than knowing that product marketers apply outputs for landing page drafts, but sales managers abandon outputs for account research.
Inspect to apply conversion isolates the post-output gap. If users inspect the output but do not apply it, the problem is rarely awareness. They saw the result. Something stopped them after seeing it.
Regeneration to apply ratio shows whether users are iterating toward success or spinning. Some regeneration is healthy. A long chain with no application is not exploration, it is failed steering.
Edit depth before application tells you whether the product is saving work or creating cleanup. Heavy edits are not always bad. Grammarly-style products expect human revision. But if edit depth rises while application falls, users may be doing quality assurance that the product should have helped with. This is often where users stop editing and start abandoning.
Applied output reentry compares users who applied output with users who only generated or inspected it. If applicators come back for the next similar job and inspectors do not, you have a clear adoption lever: get more inspected outputs across the application line.
How to read the pattern without guessing
Output abandonment is not one problem. The pattern tells you where to look.
| Pattern | Probable cause | Product response |
|---|---|---|
| User abandons immediately after output | Relevance or framing mismatch | Improve task setup, examples or default constraints |
| User reads for a long time, then leaves | Trust gap | Add evidence, assumptions, provenance or review paths |
| User regenerates repeatedly | Steering problem | Provide better controls than “try again” |
| User edits heavily, then abandons | Broken correction loop | Make local fixes easier than full rewrites |
| User applies once, then never returns | Weak recurring job | Tie the feature to the next natural work cycle |
Be careful with the trust pattern. Adding a confidence badge is not a fix if the product cannot explain why the user should believe it. Trust comes from verifiable cues, usable constraints and graceful recovery when the output is wrong. If your sessions show repeated checking, rephrasing or outside verification, you may be looking at an AI UX trust problem rather than a model quality problem.
Fix the handoff, not just the output
Many teams respond to abandonment by trying to improve the generated answer. Sometimes that is correct. Often the answer is good enough, but the handoff is weak.
The user still has to decide what to do next. They may need to verify facts, adapt tone, match a format, remove risky claims or translate a generic answer into their company context. If your product leaves all of that work to the user, the output can look impressive and still fail adoption.
Practical fixes usually sit close to the application moment:
- Format the output for the destination, not for a chat window.
- Show the assumptions the system used, especially when the user did not provide enough context.
- Offer local edit controls for tone, length, audience, risk and format.
- Make “apply” actions specific to the workflow, such as insert into brief, create ticket, update draft or send reply.
- Preserve user corrections so the next output does not repeat the same mistake.
The blunt test is simple: after the output appears, does the product make the next action easier or does it hand the user a new review task?
A 30-minute diagnostic
Pick one high-intent workflow where users already request AI output. Pull recent sessions or events for that workflow only. Do not average across every AI touchpoint.
Classify each generated output into one of four states: abandoned immediately, inspected only, modified but not applied or applied. Then segment by entry point and user role. You are looking for the first consistent break after generation.
If most users never inspect, your problem is before output. If they inspect but do not apply, the output is not crossing the trust or handoff gap. If they modify repeatedly, the steering loop is broken. If they apply but do not reenter, the feature may help once but not attach to a recurring job.
That is enough to choose the next experiment. You do not need a full retention study to see where adoption is leaking.
Frequently Asked Questions
What is output abandonment in an AI product? Output abandonment is when a user receives AI-generated output but does not use it in the actual workflow. They may read, copy, regenerate or edit it, but the job does not move forward.
Why does output abandonment happen before retention drops? Users often try an AI feature several times before they stop returning. During those attempts, the product can still show healthy activity while users are learning that the output is not worth the review or repair effort.
Is output abandonment always a model quality problem? No. Model quality can be one cause, but abandonment often comes from weak handoff, missing verification cues, poor output format, unclear next steps or a correction loop that makes edits feel expensive.
What is the best metric for spotting output abandonment? Start with output application rate. It shows how often generated outputs become part of the user’s work. Pair it with inspect to apply conversion and regeneration to apply ratio for a clearer diagnosis.
Next action
If you want a structured way to diagnose this pattern, run the symptom through the free AI adoption triage tool. For a deeper team workshop, the AI Product Adoption Deck includes diagnostics, action cards and fillable templates for turning abandonment signals into product decisions.