How to Measure AI Feature Retention Beyond Weekly Active Use
Measure AI feature retention beyond weekly active use with metrics for output use, workflow return, trust, correction, and habit formation.

Your AI feature has acceptable weekly active use. People still open it. The chart is not embarrassing.
But interviews tell a different story. Users try the feature when they remember it exists, regenerate a few times, copy a sentence, then finish the real work somewhere else. A month later, they say it was interesting, but not part of their workflow.
That is the measurement problem. Weekly active use tells you the feature was touched. It does not tell you whether the AI became a trusted step in a recurring job.
For AI product adoption, retention has to measure return to value, not return to interface.
Weekly active use can count failure as retention
A normal SaaS feature often has a clear action. A user exports a report, sends an invoice, schedules a campaign, or updates a record. If they repeat that action, retention is usually meaningful.
AI features are messier. The same user can generate five outputs for five very different reasons:
- They got value and want another draft.
- They did not trust the first output.
- They are testing what the system can do.
- They are trying to rescue a bad result.
- They clicked because the AI entry point was pushed in front of them.
All five can show up as active use. Only one is clearly healthy.
This is why AI feature retention needs a stricter definition. The question is not whether users came back to the AI. The question is whether users came back to use AI inside a job they were already going to do, accepted enough of the result, and moved the work forward.
If your dashboard cannot answer that, weekly active use is probably hiding the real adoption break. For a broader event model, the guide on AI metrics that show where adoption actually breaks is a useful companion.
Define the retained behavior before you define the metric
Start with the product behavior you want to see. Not the AI behavior. The user behavior.
A retained AI user is not someone who generated output in week 1 and again in week 2. A retained AI user is someone who returned to a recurring opportunity and used the AI output to complete part of that opportunity.
That definition has four parts:
| Retention layer | What you are checking | Example event |
|---|---|---|
| Opportunity recurrence | Did the user face the job again? | User started another support reply, campaign brief, code task, research query, or doc update |
| AI reentry | Did they choose AI again for that job? | User opened the AI assistant from the relevant workflow |
| Output application | Did the AI result enter the work product? | User inserted, accepted, exported, merged, cited, or saved the output |
| Next-cycle return | Did they come back at the next natural interval? | User applied AI again during the next task cycle, not just the next calendar week |
The key move is separating opportunity recurrence from AI reentry. If a user did not write another sales email this week, they cannot retain your AI email writer this week. They had no chance to use it.
This is where weekly active use gets lazy. It treats every week as equally meaningful. Your product probably does not work that way.
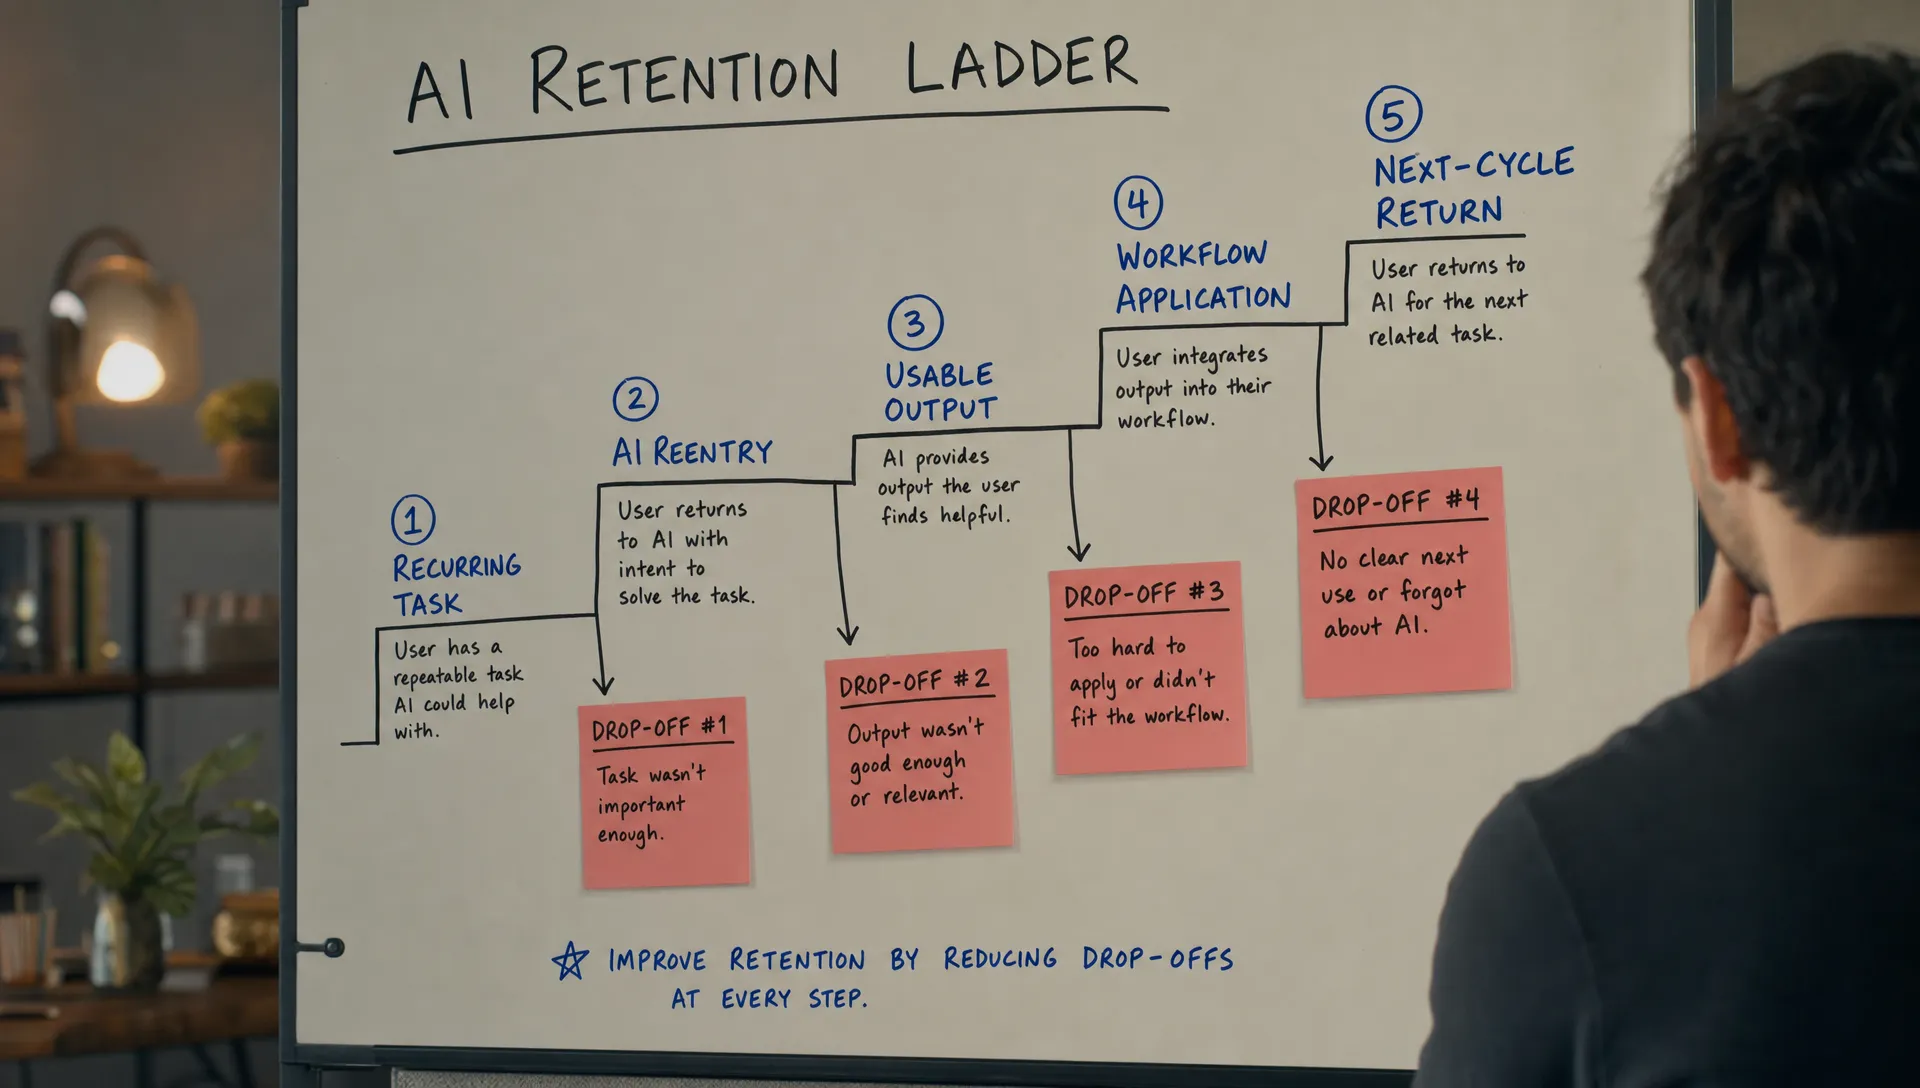
Measure the retention ladder, not one event
AI adoption is a chain. Retention breaks when any link gets weak. A useful dashboard should show the ladder, from task opportunity to applied output to repeat use.
| Metric | What it tells you | Bad signal |
|---|---|---|
| Opportunity return rate | Whether users had the job again | Low opportunity return means the feature may target an occasional job |
| AI reentry rate | Whether users chose AI when the job came back | Low reentry means the entry point, memory, or perceived value is weak |
| Prompt or input completion rate | Whether users knew how to ask for help | Drop-off here suggests prompt paralysis or unclear setup |
| Output application rate | Whether the result made it into the workflow | Low application means output feels unusable, risky, or hard to transfer |
| Edit-to-accept ratio | How much work users do before using the result | Heavy edits may mean useful direction but poor final fit |
| Regeneration rate before abandon | Whether users are stuck trying to get a usable answer | High regeneration plus abandon is usually a trust or control problem |
| Verification burden | How much checking is required before use | High checking means adoption may fail in time-sensitive workflows |
| Next-cycle AI return | Whether AI becomes part of the routine | Low return after applied output means value was one-off or not memorable |
Do not treat these as vanity metrics. Treat them as diagnostic cuts.
If AI reentry is high but output application is low, users believe the feature might help, but the output does not survive contact with the task. If output application is high but next-cycle return is low, the feature worked once but did not create a habit trigger. If prompt completion is low, you may not have a retention problem yet. You may have an input design problem.
Cohort by job, not by signup date
Signup cohorts are often too blunt for AI feature retention. AI usage depends on the job cadence.
A writing assistant inside a daily communication tool may have a daily or weekly opportunity. A research assistant may have bursts around planning cycles. A slide generator may only matter before a board meeting. A code assistant may map to tickets, not calendar weeks.
If you force all of those into weekly active use, you will misread the product. Some features will look under-retained because the job is occasional. Others will look healthy because users keep poking at them without applying the output.
Better cohorts are based on job recurrence:
| Job cadence | Better retention window | What to measure |
|---|---|---|
| Daily workflow | 1 to 7 days | Repeated applied output inside the same workstream |
| Weekly workflow | 7 to 14 days | Return when the next planning, writing, review, or reporting task appears |
| Project workflow | Task cycle based | AI reuse across project milestones |
| Episodic workflow | Event based | Reuse at the next comparable event, such as renewal, launch, audit, or meeting prep |
This matters for products like Notion AI, Grammarly, Perplexity, Cursor, and GitHub Copilot. They do not all earn retention on the same clock. Grammarly can be useful every time a user writes. Perplexity may be retained if the user returns for a new research need. Copilot may be retained when a developer keeps accepting help across tickets. The metric has to match the job.
Separate healthy repetition from unhealthy repetition
More AI usage is not always better. Sometimes it means the user is fighting the system.
A user who regenerates eight times and leaves with nothing is active. They are also telling you the feature failed. A user who edits one draft, inserts it, and returns next week may look less active, but they are closer to retained.
You need to tag repeat behavior by outcome:
| Repeat pattern | Likely meaning | Product response |
|---|---|---|
| Generate, accept, return | Healthy retention | Improve speed, defaults, and workflow depth |
| Generate, edit, accept, return | Usually healthy if edit cost is low | Add controls, examples, and reusable preferences |
| Generate, regenerate, abandon | Output mismatch or lack of control | Improve input scaffolding, constraints, and previews |
| Generate, copy, rewrite elsewhere | Partial value with workflow leakage | Improve handoff, formatting, and destination fit |
| Generate, verify heavily, rarely return | Trust burden is too high | Add citations, source visibility, confidence cues, or safer scopes |
| Open AI, close without input | Entry point curiosity or prompt paralysis | Clarify use cases and reduce blank-canvas starts |
The biggest mistake is averaging these patterns together. That produces a comforting number and a useless diagnosis.
Track the destination of the output
For AI features, the output destination is often the real retention signal.
Did the text land in the email composer? Did the summary get attached to the CRM record? Did the code suggestion make it into the commit? Did the research answer get cited in a workspace? Did the generated SQL query get run, modified, or discarded?
A generation event is not enough. Even a copy event can be ambiguous. The strongest signals are downstream actions that show the output was used in context.
Think in terms of applied output:
| AI feature type | Weak retention event | Stronger retention event |
|---|---|---|
| Writing assistant | Generated draft | Draft inserted, edited, and sent |
| Research assistant | Asked question | Answer saved, cited, or used in a decision artifact |
| Coding assistant | Suggestion shown | Suggestion accepted and retained after edits |
| Analytics assistant | Chart generated | Chart added to report or query reused |
| Support assistant | Reply generated | Reply reviewed, sent, and not immediately overwritten |
This is where many teams discover the uncomfortable truth. Users are not retaining the AI feature. They are sampling it.
Use retention metrics to choose the next product bet
The point of measuring AI feature retention beyond weekly active use is not to build a prettier dashboard. It is to make a better product decision.
If users do not reenter the AI when the job returns, work on triggers, entry points, positioning, and remembered context. The product has not earned recall.
If users reenter but do not complete inputs, work on onboarding, prompt scaffolds, examples, and constraints. The user does not know how to steer the system.
If users complete inputs but abandon outputs, work on output quality in the product sense. That may include structure, specificity, source grounding, editability, or fit with the user’s actual artifact.
If users apply output once but do not return, work on habit formation. Show the user when the same job comes back. Carry forward preferences. Make the second use easier than the first.
If you are not sure where the break is, run the symptom through a diagnostic path before choosing a fix. The free AI adoption triage tool is built for that kind of first pass.
Frequently Asked Questions
Is weekly active use useless for AI features? No. It can still show whether people are touching the feature. It is just too shallow to prove retention. Use it as a top-level health check, not the main adoption metric.
What is the best AI feature retention metric? The strongest single metric is usually next-cycle applied output. It measures whether the user returned when the same job came back and used the AI result inside the workflow.
How should we measure retention for AI features used occasionally? Use job-based or event-based windows instead of calendar weeks. Measure whether the user comes back at the next relevant task, project milestone, meeting cycle, launch, audit, or decision moment.
How do we know if repeated AI usage is good or bad? Look at the outcome after each repeat. Generate, accept, and return is healthy. Generate, regenerate, and abandon is usually a failure signal. The same activity count can mean opposite things.
Should output quality be part of retention measurement? Yes, but measure it through behavior where possible. Application rate, edit burden, verification steps, and abandonment after regeneration often reveal perceived quality better than a satisfaction score alone.
Turn retention into a diagnosis
If your AI feature has weekly active use but no habit, do not start with a new model, a louder entry point, or another onboarding tooltip. First define the retained behavior. Then instrument the path from recurring job to applied output to next-cycle return.
That is the difference between measuring activity and measuring adoption.
If you want to go deeper, the AI Product Adoption Deck includes diagnostics, action cards, and workshop templates for teams trying to understand why shipped AI features are not retaining. Use it when your dashboard says active, but your users are not building the feature into their work.