Build an AI Adoption Index That Tracks Applied Value
Build an AI adoption index around verified output use and repeat value. Get a practical formula, event plan and worked example.

AI generations are up, but users still finish the real task somewhere else. Your dashboard calls that adoption because people opened the feature, submitted a prompt or accepted a suggestion. An AI adoption index should expose this gap, not average it away. Start by measuring whether useful output reaches the workflow and earns another use when the need returns.
Find the break your usage chart hides
A generation event proves the system produced something. It does not prove the user checked it, applied it or benefited from it.
Even an “accepted” event can mislead. Someone might insert a draft, then delete it. A support agent might copy a suggested response but rewrite every substantive claim. Neither action establishes applied value on its own.
Before building a score, choose one workflow and name its completion event. For a support assistant, that could be a response sent to the customer. For a coding assistant, it might be a change merged after the required checks. Keep those definitions separate. Combining unrelated workflows makes changes harder to interpret.
Define your AI adoption index around repeat applied value
Use a narrow definition: the share of eligible user-workflow pairs that achieve quality-confirmed application on at least two distinct task occasions. This is a proposed product metric, not an industry-standard benchmark.
A user-workflow pair means one person performing one defined job. Someone using both summarization and reply drafting contributes to two separate workflow cohorts, not one blended user record.
Define eligibility independently of AI usage. For example, include support agents who received at least two suitable tickets during a fixed observation window, whether they opened the assistant or not. Otherwise, your denominator excludes the people who never started.
Choose the window from the job’s cadence. A weekly planning tool needs more time than a tool used on every support ticket. If you cannot observe opportunities outside AI usage, label the score as covering only the measurable workflow population.
Use one auditable formula
Calculate:
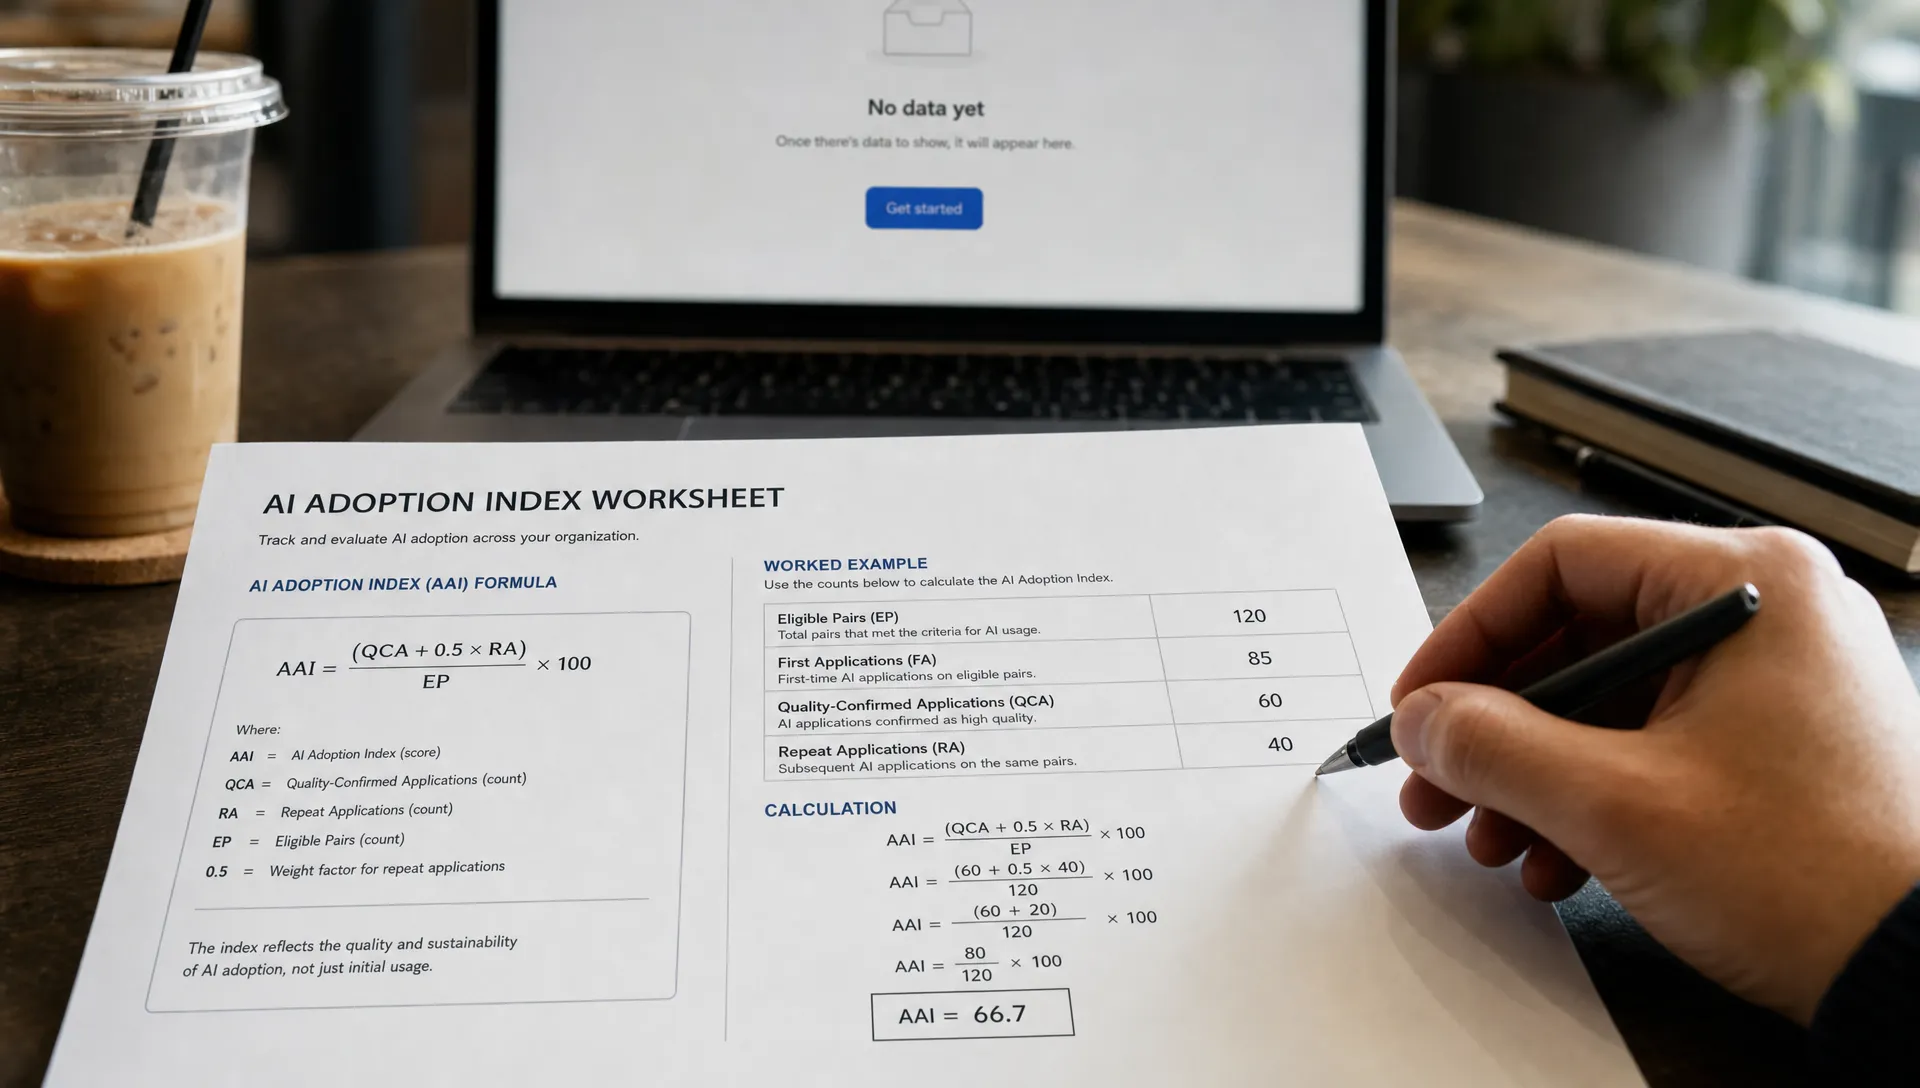
Index = 100 × user-workflow pairs with two quality-confirmed applications ÷ eligible user-workflow pairs.
For this AI adoption index, “quality-confirmed” needs a task-specific rule. A support response might need to be sent, meet a factual accuracy rubric and avoid substantive correction within a defined follow-up period. Sending alone is not enough.
Set that rule before reviewing the results. Start with human review where necessary, then validate any automated proxy against it. Confidence scores and acceptance clicks are not substitutes for checking whether the output worked.
Track unknown outcomes separately from failures. If quality cannot be confirmed, the pair has not yet met the numerator rule. Report that missing evidence alongside the score so an instrumentation gap does not become a product diagnosis.
Instrument the workflow, not just the assistant
You need to connect the AI interaction to the downstream task. The following event names are illustrative, not a required schema.
| Event | What it establishes | Useful fields |
|---|---|---|
task_opportunity |
A suitable task existed, independent of AI use | User ID, workflow ID, task ID, timestamp |
output_generated |
The assistant produced a result | Task ID, output ID, feature version |
output_applied |
Output entered the real workflow | Output ID, destination, application timestamp |
quality_resolved |
The application passed, failed or remains unknown | Output ID, rubric version, outcome |
task_completed |
The downstream job reached its defined endpoint | Task ID, completion status, timestamp |
Use stable identifiers to connect these events. A second application must belong to a different task occasion, not a regeneration or another edit in the same session.
Do not log raw prompts or customer content by default. Collect the minimum metadata needed and put any content review behind appropriate access and retention controls.
For a broader view of event selection, the guide to metrics that reveal where AI adoption breaks complements this implementation-focused approach.
Work through a cohort before building the dashboard
Suppose a hypothetical cohort contains 100 eligible agent-workflow pairs. All have at least two suitable task opportunities and enough follow-up time for outcome review.
Of those 100 pairs, 60 apply at least one output. Of those 60, 45 have a first quality-confirmed application. Of those 45, 27 also achieve a quality-confirmed application on a separate task occasion.
The AI adoption index is 27, because 27 of 100 eligible pairs met the repeat-value rule.
Keep the intermediate rates visible: first application is 60%, first quality confirmation among applicants is 75% and qualified repeat among those with a confirmed first application is 60%. These are nested stages, not independent metrics to average together.
Multiplying those conditional rates also produces 27%. The headline score gives you a compact summary. The stage counts tell you where to investigate.
Diagnose the weak transition before choosing a fix
Low first application suggests that output is not reaching the task. Inspect a small set of abandoned results. Users may lack a safe preview, an editable format or a direct path into the destination workflow. Improving the model will not necessarily fix a copy-and-paste barrier.
Low quality confirmation points elsewhere. Review failed and unknown outcomes separately. Factual errors require a different response from missing verification evidence. Heavy correction can also reveal that users are doing more work than the assistant saves.
Low qualified repeat deserves a next-task review. Did the feature appear when the next suitable job arrived? Did the user choose the old workflow because checking the previous output cost too much?
Track correction time and downstream errors beside adoption. A higher score is not a win if users repeat an unsafe behavior or lose more time reviewing than they save.
Test changes without moving the denominator
Compare your AI adoption index across cohorts with the same workflow, eligibility rule, observation window and quality rubric. Separate assisted onboarding from self-serve use and mandatory rollout from voluntary choice. Otherwise, a change in population can look like a better product.
When you change the rubric or event logic, version the definition. Recalculate earlier periods where possible rather than drawing a continuous trend across incompatible measures.
Keep acquisition source as a segment, not evidence of value. If AI search brings new signups, assess whether those referrals produce qualified traffic before crediting that channel with adoption. Then compare similarly mature workflow cohorts. A referral identifies an observable arrival path, not proof that the source caused repeat value.
For small cohorts, publish counts beside percentages and avoid declaring a winner from a few additional repeat users.
Frequently asked questions
Should the AI adoption index include generation volume? Keep generation volume as a diagnostic metric, not part of this score. More generations can mean productive use, repeated failure or users searching for an acceptable answer.
Does every task need AI assistance? No. The index measures demonstrated repeat value, not maximum AI usage. Define suitable tasks carefully and preserve a good non-AI path. Some tasks are faster or safer without assistance.
Can sampled quality reviews support the score? Yes, but the result becomes an estimate. Report the sampling method and uncertainty. Do not present sampled quality rates as though every application was verified.
Make one measurement decision this week
Choose one workflow. Write down its eligible population, application event, quality rule and repeat occasion. Then trace a small cohort manually before asking engineering to automate the score.
If the break is still unclear, use the free Triage tool to structure the diagnosis. For a deeper working session, the AI Product Adoption Deck provides 12 diagnostics, 80 action cards and 12 workshops with fillable deliverable templates. Bring the weak transition, not just the headline number.